# setting up
library(terra)
terra 1.8.5LANDSAT, SIEVE
This R script reads in NDWI images derived the blue-red/blue+red equation, converts them to binary images using a threshold from the literature, and then removes outlier pixels which are disconnected from large water bodies.
# setting up
library(terra)terra 1.8.5Just working with one file in this example. But you can imagine reading in a list of files and performing this operation iteratively with a for loop.
r <- rast("../ndwi_ice_small.tif")
plot(r)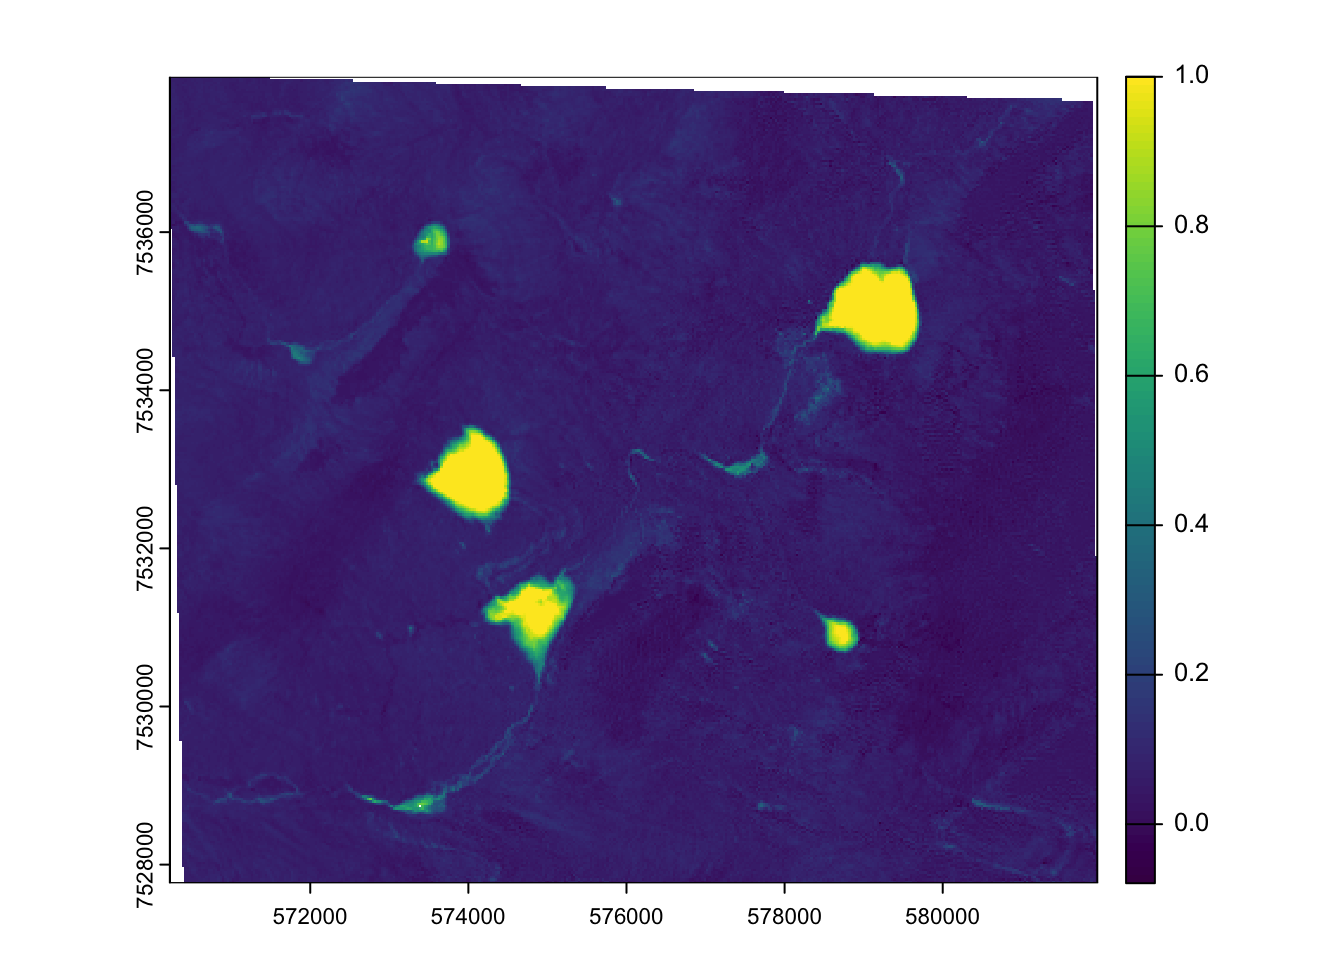
So this is what the NDWI image looks like. Let’s visualize as lake vs non lake.
lake_mask <- r > 0.25
plot(lake_mask)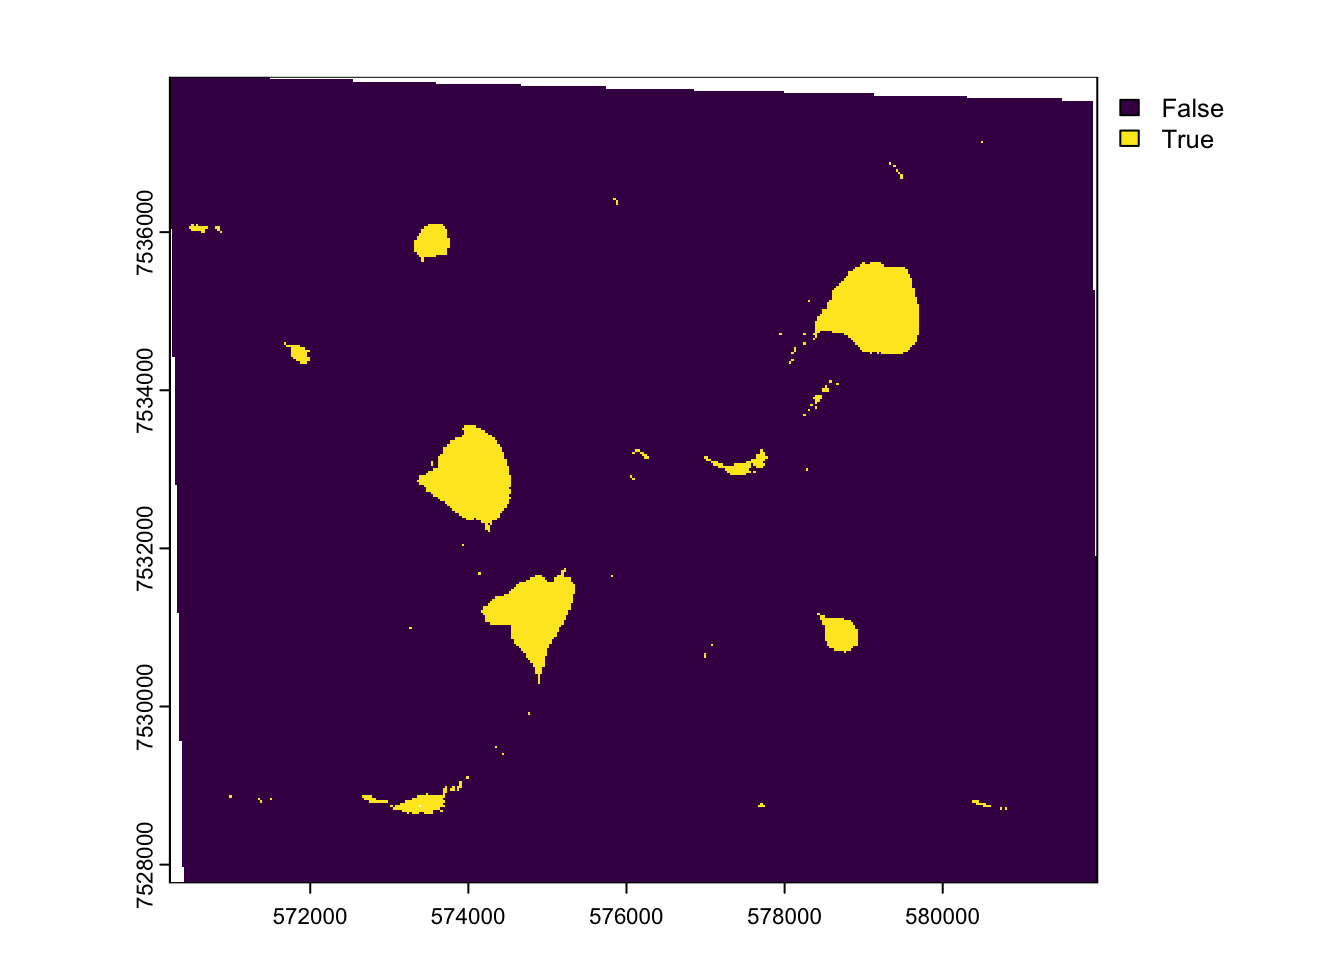
This looks good but if you look at some of the isolated yellow pixels, they would then be considered a lake pixel even if disconnected from the larger lake. So we remove those.
# function to sieve
lake_sieve <- function(ndwi_thres_raster) {
  # get connected components
  connected_comp <- patches(ndwi_thres_raster, directions = 4, zeroAsNA = TRUE)
  components <- unique(values(connected_comp), na.rm = TRUE)
  components <- components[components != 0 & !is.na(components)]
  cell_indices <- unique(values(connected_comp, na.rm = TRUE))
  # empty mask for valid lakes
  valid_lake_mask <- rast(ndwi_thres_raster)
  values(valid_lake_mask) <- 0
  min_pixel <- 10
  min_width <- 1
  #loop over each ndwi scene
  for (comp_id in components) {
    # get cell indices for the current cc
    cell_indices <- which(values(connected_comp) == comp_id)
    if (length(cell_indices) < min_pixel) next
    # convert cell indices to coordinates
    coords <- xyFromCell(ndwi_thres_raster, cell_indices)
    width <- length(unique(coords[, "x"]))
    height <- length(unique(coords[, "y"]))
    # check if the component meets width/height requirements
    if (width <= min_width || height <= min_width) next
    values(valid_lake_mask)[cell_indices] <- 1 #update valid lake
  }
  return(valid_lake_mask)
}
Apply the function
sieved_r <- lake_sieve(lake_mask)
plot(sieved_r)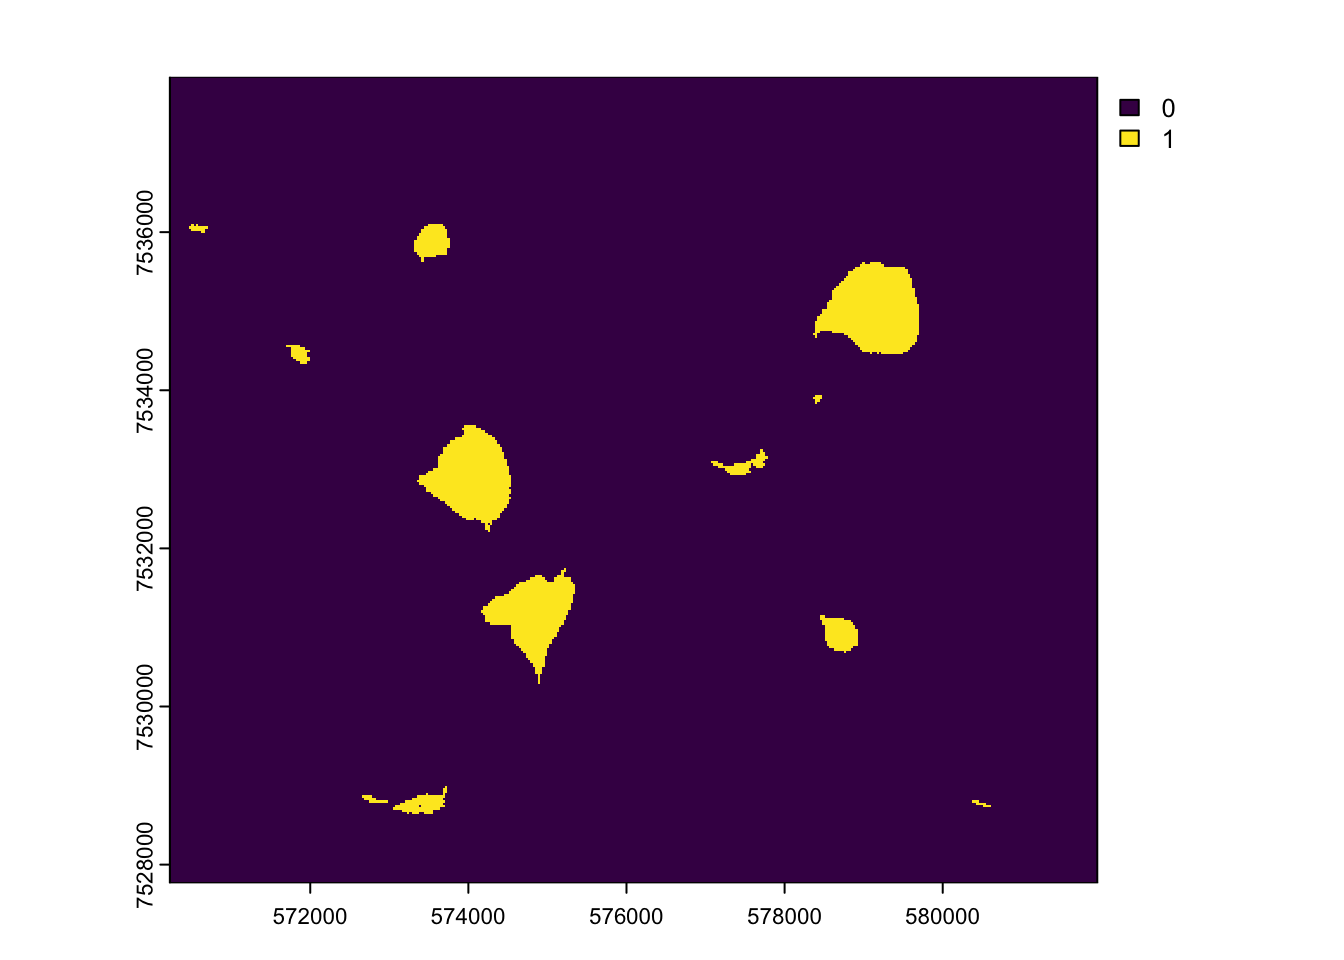
Looking good!! This is just a qualitative sieving technique and could easily adapt to more stats-based approaches. This layer can now be used to mask other rasters to. In my approach, I mask images in the red and panchromatic wavelengths by this image to isolate lakes and apply radiative transfer equations.