library(terra)terra 1.8.5LANDSAT, NDWI
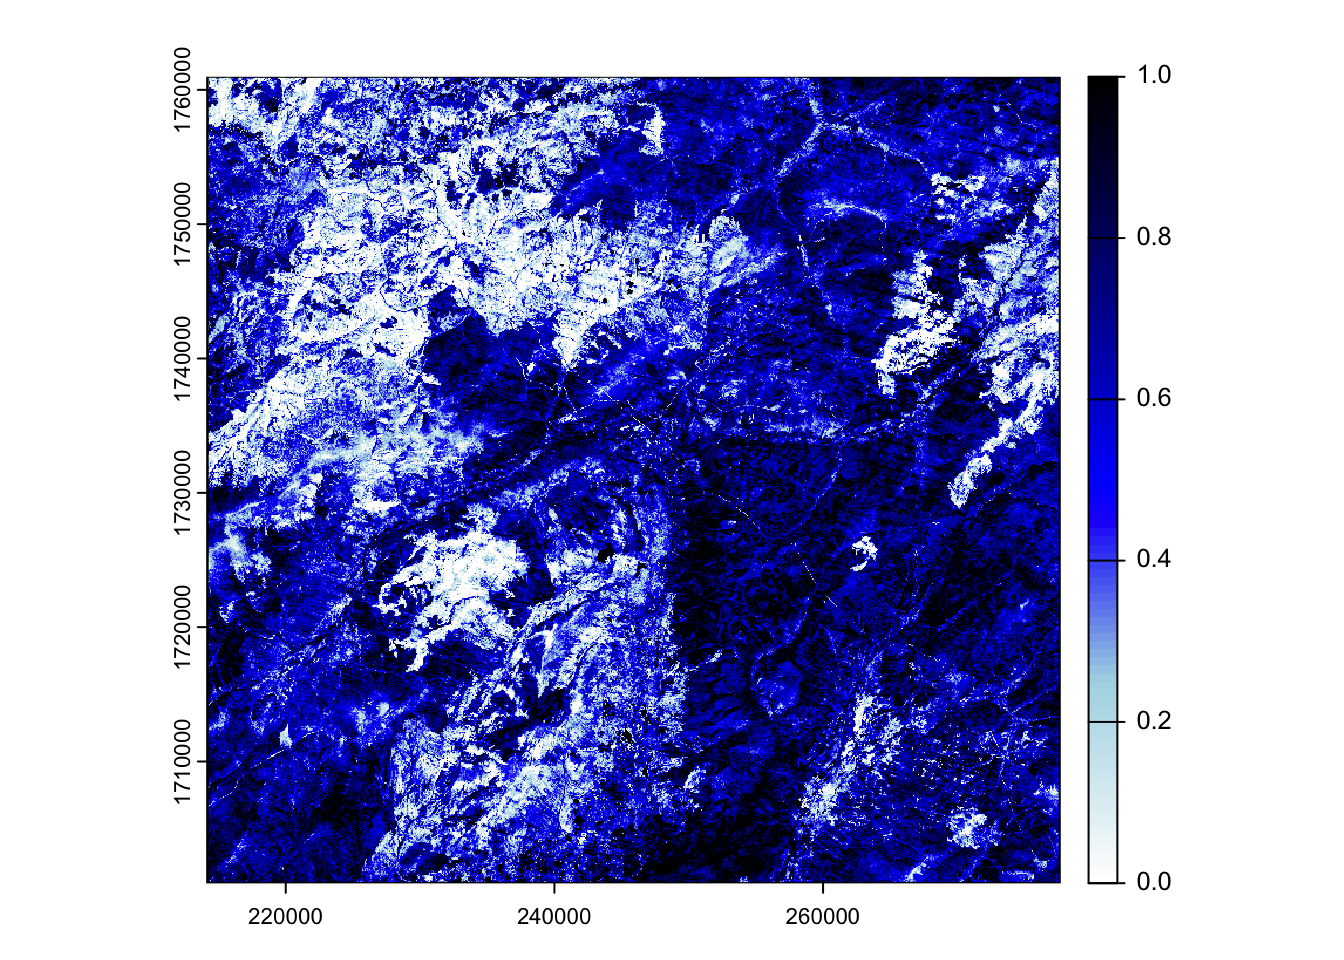
Let’s read in a raster and set a color palette to visualize by. This example file is a modified normalized difference water index image within interior Alaska.
library(terra)terra 1.8.5colors <- colorRampPalette(c("white", "lightblue",
"blue", "darkblue", "black"))(100)
r <- rast("../FullComp_Dalton_2015.tif", lyr = 24)
plot(r, col = colors)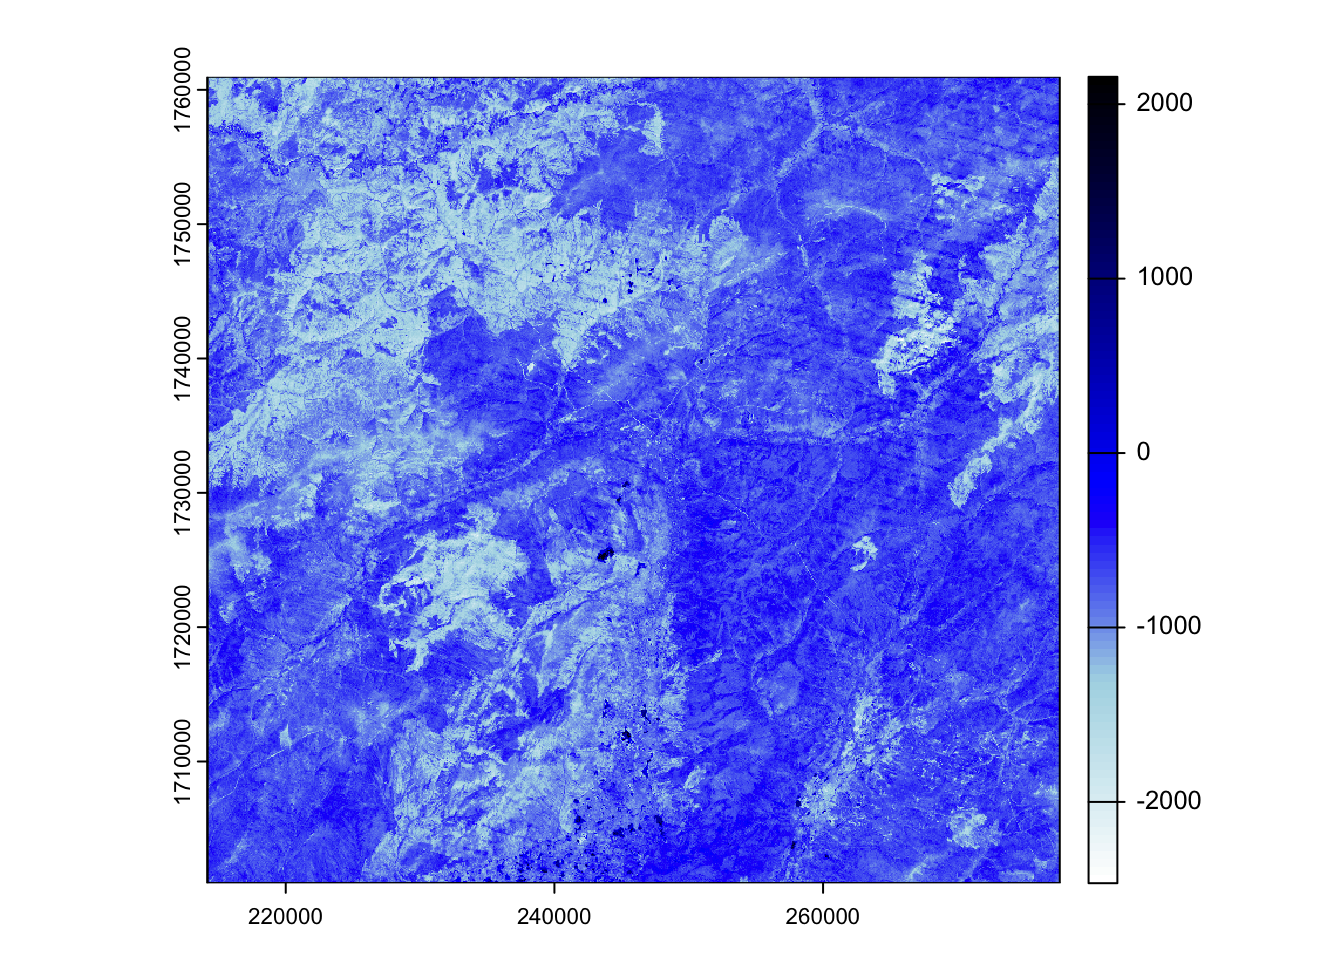
Looks great. Now if we want to increase the contrast between different pixel values. We can do this
# contrast stretch
p_low <- quantile(values(r), 0.05, na.rm = TRUE)
p_high <- quantile(values(r), 0.95, na.rm = TRUE)

r_stretched <- clamp((r - p_low) / (p_high - p_low), lower = 0, upper = 1)
plot(r_stretched, col = colors)